Eichler Market › Market reports
Eichler Q3 2026 Market Report
16 Eichler Sales, $54M Total: Q3 2026 Closes With a $3.2M Gap Between Fairwood Ave and Parkinson Ave
Sixteen recorded sales in Q3 2026 produced $54,014,000 in combined volume. The quarter's range — $2.1M to $5.3M — traces a market where per-square-foot pricing varied by nearly 2.5x depending on where and how much.
The period at a glance
The top of Q3 2026 and the bottom sat $3.2 million apart, and the spread in price per square foot was wider still. The quarter's sixteen closings — a small sample, noted here and carried throughout — recorded a median sale price of $3,340,000 and a median of $1,793 per square foot, against total volume of $54,014,000. No list prices appear in the recorded-sales source for this period, so no comparison against asking is possible.
| Metric | Q3 2026 |
|---|---|
| Closings | 16 |
| Total volume | $54,014,000 |
| Median price | $3,340,000 |
| Median price per sq ft | $1,793 |
| Median square footage | 1,883 |
| Median lot size | 7,045 sq ft |
| Low sale | $2,100,000 |
| High sale | $5,300,000 |
| Segment | Single Family only |
All sixteen closings were single-family homes. The quarter ran from July through September, though no sales recorded in July appear in this dataset — all activity fell in August (four closings) and September (twelve). That concentration in the back half of the quarter, and the resulting shape of the data, is worth keeping in mind when reading the month-by-month figures.
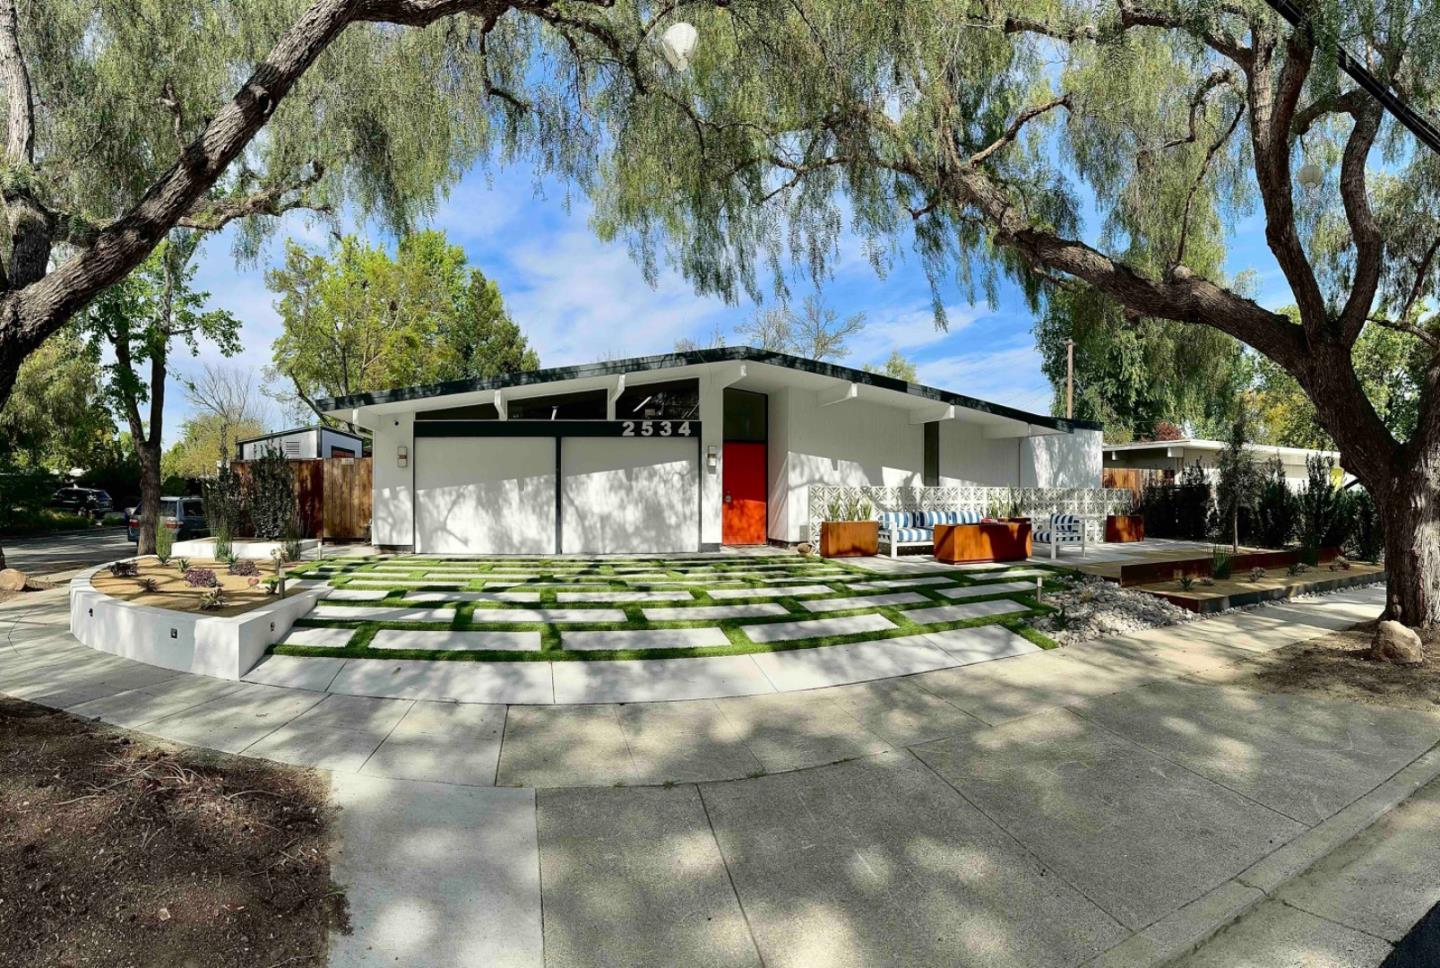
Per-square-foot pricing ranged from $1,100 at 2534 Dumbarton Ave to $2,704 at 346 Tioga Ct — a spread of $1,604 per square foot across homes built between 1954 and 1973, none of them dramatically different in lot size. The variance is not random noise across sixteen sales; it maps, with some fidelity, onto price band. The $3M–$5M band carried a median of $2,105 per square foot. The $2M–$3M band sat at $1,407. That $698 gap between adjacent bands is where much of the quarter's character lives.
The sales
The table below is the complete quarter — all sixteen closings, ordered by price.
| Address | Closed | Beds | Sq Ft | Year Built | Lot Sq Ft | $/Sq Ft | Sale Price |
|---|---|---|---|---|---|---|---|
| 1131 Parkinson Ave | Sep 10 | 4 | 1,965 | 1973 | 6,839 | $2,697 | $5,300,000 |
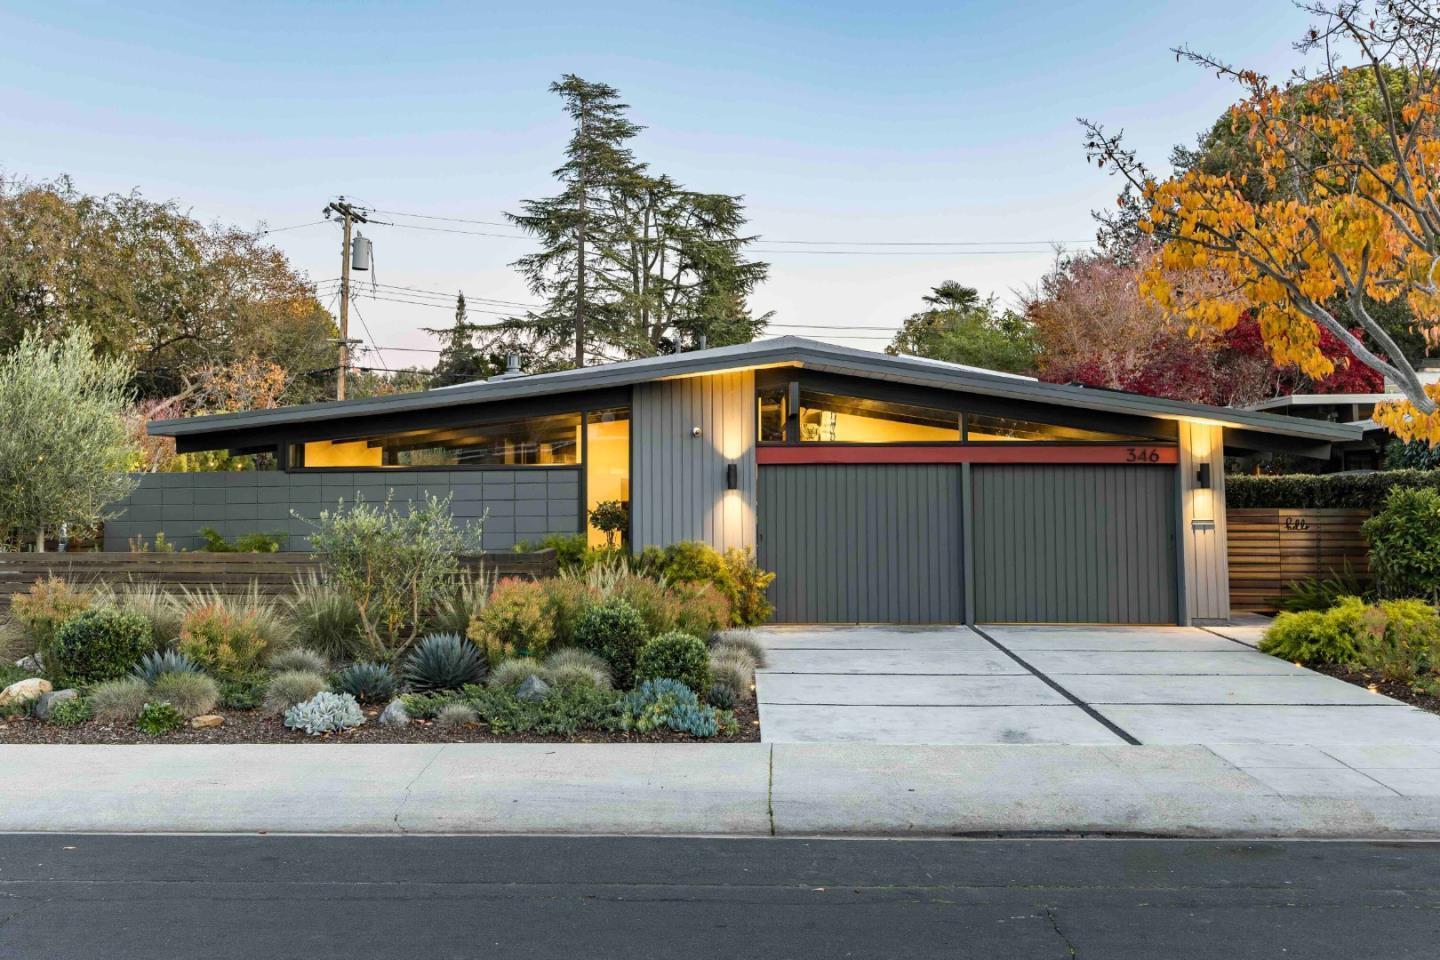
| 346 Tioga Ct | Aug 10 | 3 | 1,845 | 1954 | 6,732 | $2,704 | $4,988,000 |
| 788 Ames Ave | Sep 21 | 5 | 2,949 | 1960 | 8,083 | $1,475 | $4,350,000 |
| 3454 Greer Rd | Sep 17 | 4 | 1,920 | 1957 | 6,000 | $2,188 | $4,200,000 |
| 897 Newell Rd | Aug 25 | 3 | 1,755 | 1955 | 8,025 | $2,222 | $3,900,000 |
| 941 Eichler Dr | Sep 2 | 5 | 2,009 | 1972 | 8,591 | $1,917 | $3,851,000 |
| 4055 Ben Lomond Dr | Sep 9 | 3 | 1,672 | 1955 | 7,250 | $2,126 | $3,555,000 |
| 816 Lennox Ct | Sep 17 | 4 | 2,044 | 1969 | 10,692 | $1,668 | $3,410,000 |
| 1483 Chukar Ct | Aug 11 | 4 | 2,158 | 1971 | 8,207 | $1,515 | $3,270,000 |
| 948 Brookgrove Ln | Sep 9 | 4 | 1,432 | 1960 | 8,320 | $2,105 | $3,015,000 |
| 459 Oregon Ave | Sep 2 | 2 | 1,275 | 1972 | 5,710 | $2,000 | $2,550,000 |
| 1669 Fairwood Ave | Sep 15 | 4 | 1,618 | 1960 | 6,386 | $1,561 | $2,525,000 |
| 821 Cumberland Dr | Aug 6 | 4 | 2,039 | 1967 | 9,102 | $1,177 | $2,400,000 |
| 2534 Dumbarton Ave | Sep 9 | 4 | 2,091 | 1962 | 6,834 | $1,100 | $2,300,000 |
| 1663 Fairwood Ave | Sep 28 | 4 | 1,618 | 1960 | 6,386 | $1,422 | $2,300,000 |
| 1673 Fairwood Ave | Sep 10 | 4 | 1,509 | 1960 | 6,386 | $1,392 | $2,100,000 |
Days on market are not recorded in the source for any of the sixteen closings.
Four transactions deserve individual attention.
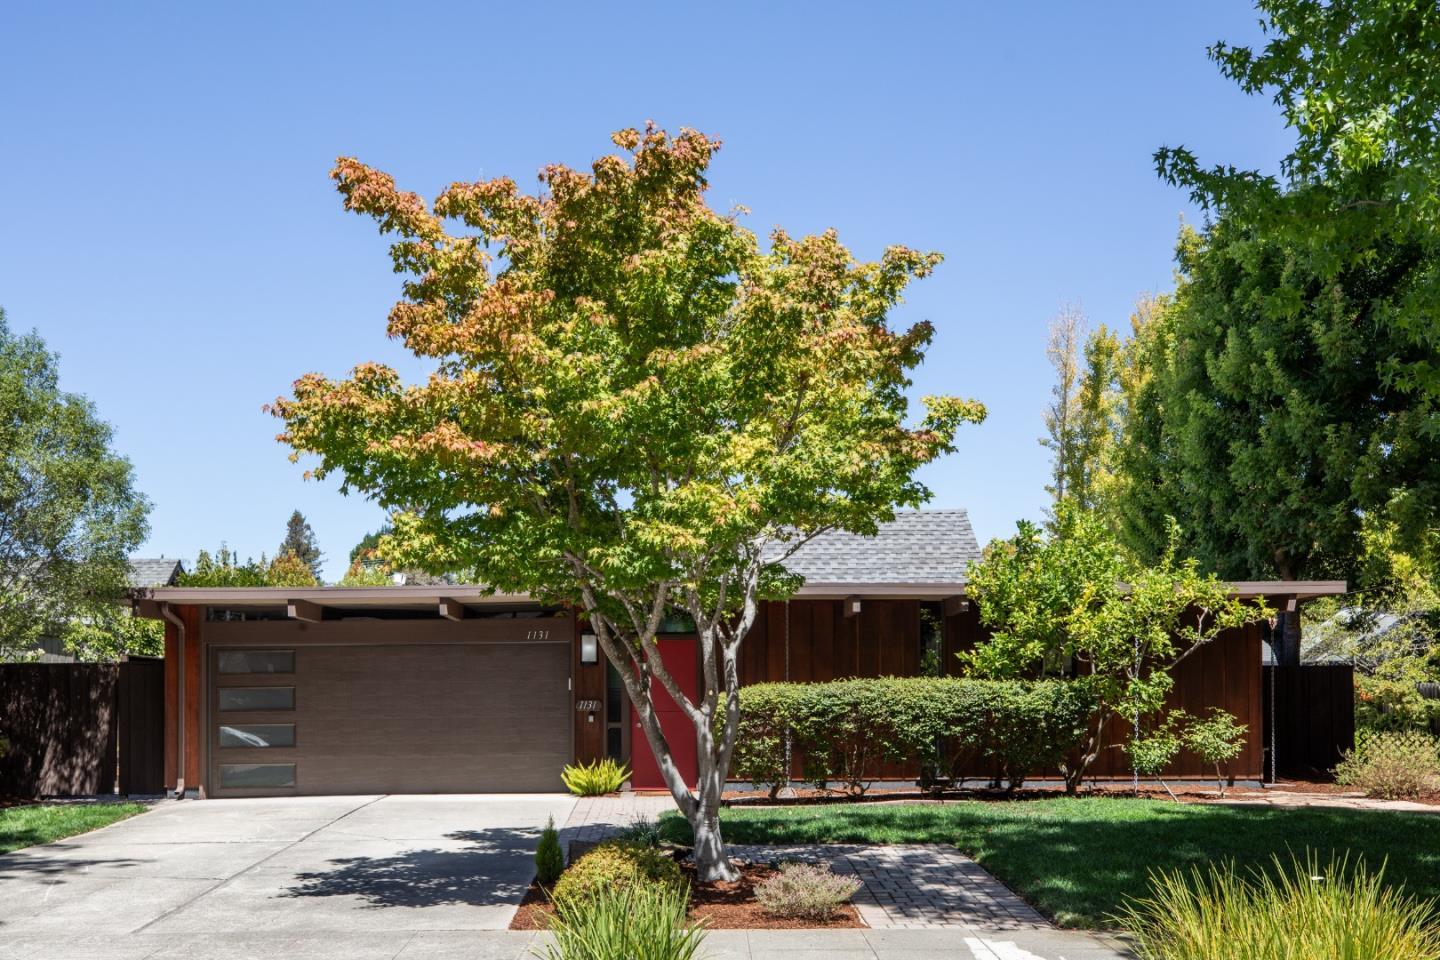
1131 Parkinson Ave — $5,300,000. The quarter's highest close, at $2,697 per square foot, on 1,965 square feet built in 1973. The price per square foot is the second-highest in the dataset — a fraction below Tioga Ct's $2,704 — but the gross number clears $5M, the only sale to do so. The lot, at 6,839 square feet, is not the largest in the quarter; the price reflects something other than raw land.
788 Ames Ave — $4,350,000. The quarter's largest home by square footage at 2,949 square feet, and the quarter's lowest price per square foot among the top-five sales at $1,475. Five bedrooms, 8,083-square-foot lot, built 1960. The gross price ranks third; the per-foot price ranks twelfth. That divergence between size and rate recurs in the dataset and is discussed further in the segment analysis.
948 Brookgrove Ln — $3,015,000. This is the quarter's smallest home among four-bedroom sales at 1,432 square feet, yet it recorded $2,105 per square foot — the highest rate in its price band and a figure that matches the $3M–$5M band's median almost exactly. A 1960 build on 8,320 square feet.
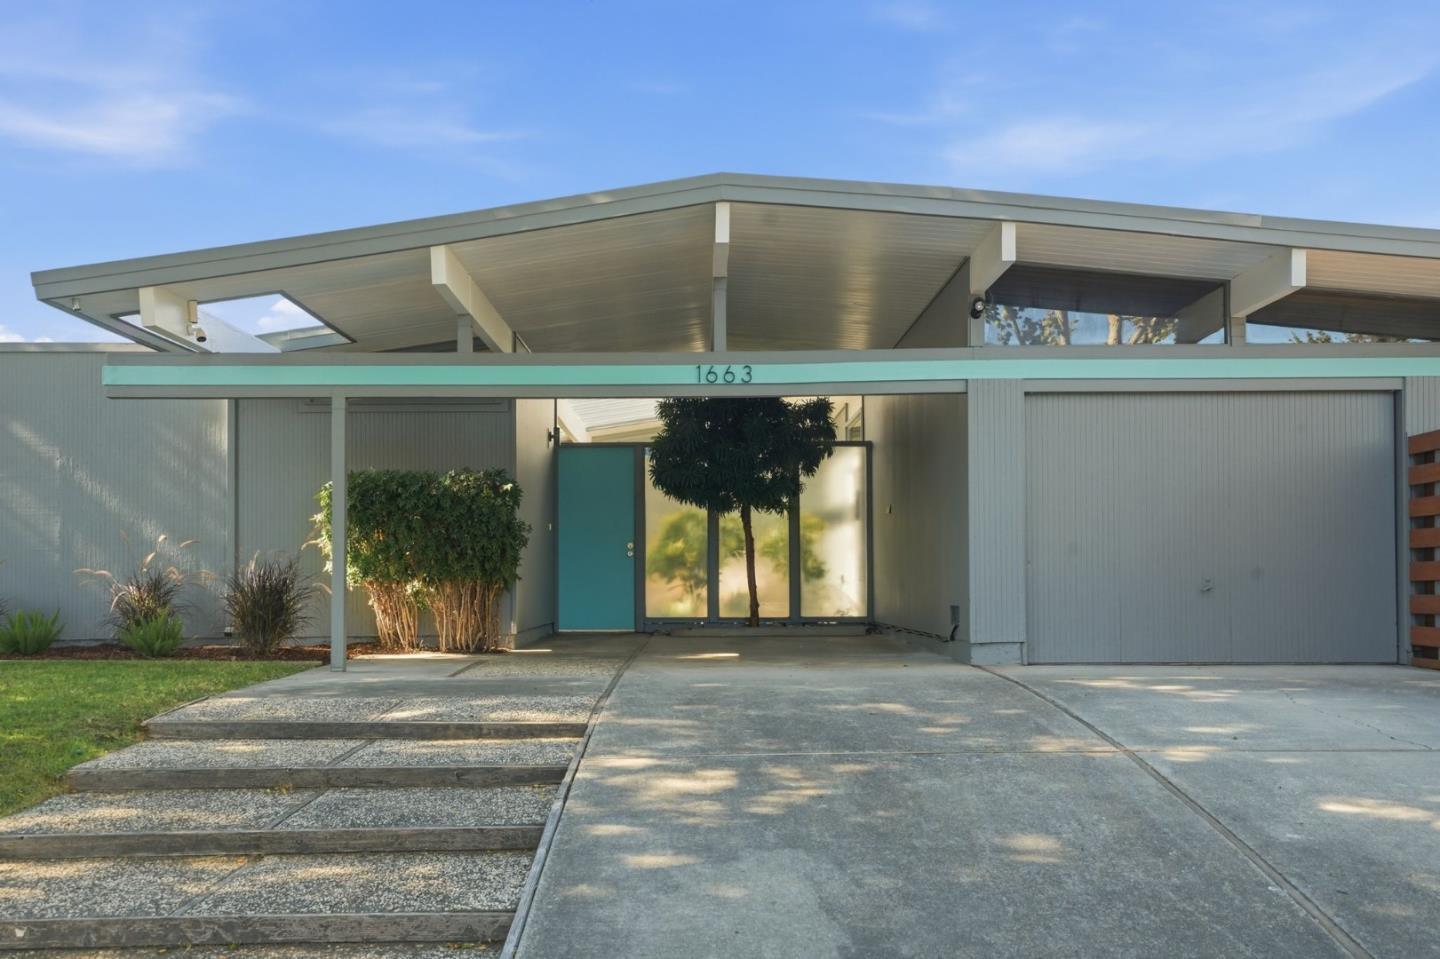
Fairwood Avenue — three closes, three prices. 1673, 1663, and 1669 Fairwood Ave closed within the same month, all 1960 builds on 6,386-square-foot lots, all with four bedrooms. They recorded $2,100,000, $2,300,000, and $2,525,000 respectively — a $425,000 spread across homes that share a street, a vintage, a lot size, and a bedroom count. Square footage accounts for some of it: 1,509, 1,618, and 1,618 square feet. The two larger homes closed at $1,422 and $1,561 per square foot; the smallest at $1,392. The $200,000 gap between the two same-sized homes on the same street is not explained by the recorded data.
Where the market split
By segment
All sixteen closings were single-family homes, so no cross-segment comparison is possible this quarter.
| Segment | N | Low | High | Median Price | Median $/Sq Ft | Median Sq Ft |
|---|---|---|---|---|---|---|
| Single Family | 16 | $2,100,000 | $5,300,000 | $3,340,000 | $1,793 | 1,883 |
By price band
The $5M-and-up band holds a single sale — 1131 Parkinson Ave — so no median is meaningful; the range is the number.
| Band | Closings | Median $/Sq Ft | Notes |
|---|---|---|---|
| $2M–$3M | 6 | $1,407 | Six sales; median of six |
| $3M–$5M | 9 | $2,105 | Nine sales; median of nine |
| $5M and up | 1 | $2,697 | Single sale; no median |
The $698-per-square-foot gap between the $2M–$3M and $3M–$5M bands is the quarter's sharpest internal divide. It does not map neatly onto square footage: the $2M–$3M band included homes ranging from 1,275 to 2,091 square feet, and the $3M–$5M band ranged from 1,432 to 2,949. Lot size tells a similar non-story: the bands overlap substantially on that metric as well.
What does map onto rate is gross price — which sounds circular, but the point is that the per-foot premium in the $3M–$5M band is not simply an artifact of smaller homes. At $2,105 median per foot versus $1,407, something beyond size and lot is being reflected in the transaction prices. The recorded data does not identify what.
One structural note: 788 Ames Ave, the quarter's largest home at 2,949 square feet, closed at $1,475 per square foot — well below the $2,105 median for its $3M–$5M band, and below the overall quarter median of $1,793 as well. Remove it, and the $3M–$5M band's character shifts. With eight sales rather than nine, the per-foot picture would look somewhat different. With sixteen total sales, individual transactions carry more weight than they would in a larger dataset.
Across the quarter
July produced no recorded closings in this dataset. All activity falls in August and September.
| Month | Closings | Median Price | Median $/Sq Ft |
|---|---|---|---|
| Jul 2026 | 0 | — | — |
| Aug 2026 | 4 | $3,585,000 | $1,869 |
| Sep 2026 | 12 | $3,212,500 | $1,793 |
With four August closings and twelve in September, the monthly medians describe very different-sized samples. August's $3,585,000 median rests on four sales: 821 Cumberland Dr ($2,400,000), 1483 Chukar Ct ($3,270,000), 346 Tioga Ct ($4,988,000), and 897 Newell Rd ($3,900,000). Remove Tioga Ct and the August median drops substantially. The month's median is a fact about four transactions, not a signal about the broader market.
September's twelve closings produce a more stable median of $3,212,500 and a per-foot median of $1,793. That matches the quarter's overall per-foot median exactly, which is unsurprising given September's numerical weight. The September closings included both the quarter's highest sale (1131 Parkinson Ave, $5,300,000) and three of its four lowest (the Fairwood Ave cluster and 2534 Dumbarton Ave). The range within a single month ran from $2,100,000 to $5,300,000.
The quarter's median price moved from $3,585,000 in August to $3,212,500 in September — a $372,500 decline. Whether that reflects composition differences between the two months' sales, or something else, cannot be determined from sixteen closings. The data records the outcome, not the cause.
What it means
For sellers The quarter's sixteen closings covered a $3.2M range in gross price and a $1,604-per-square-foot range in rate. The three Fairwood Ave sales — same street, same vintage, same lot, same bedroom count, different prices — are the clearest illustration of how property-specific variables (including ones not visible in the recorded data) drove final numbers. The per-foot median in the $3M–$5M band ran 50% above the $2M–$3M band's median rate. At sixteen total closings, the sample is thin enough that a single transaction can move the band-level picture.
For buyers The quarter's data shows a wide per-foot range even within the same price band. 788 Ames Ave at $1,475 per square foot and 948 Brookgrove Ln at $2,105 per square foot both closed in the $3M–$5M band, on roughly comparable lot sizes, in the same quarter. The recorded data does not explain the gap, which means buyers working this market are navigating variables the closing record does not capture.
For owners not transacting Total volume reached $54,014,000 across sixteen sales in two months of activity. The market produced one closing above $5M, nine between $3M and $5M, and six between $2M and $3M. The Fairwood Ave cluster — three adjacent homes closing within the same month at prices that diverged by $425,000 — is a reminder that recorded transaction prices reflect the specific circumstances of each closing, not a uniform market-wide rate.
Tim McMullen · CA DRE #02016832
tim@mcmullen.properties · (415) 691-9272
Tim McMullen, CA DRE #02016832. Real estate services provided by Tim McMullen, Broker, CA DRE #02016832. Figures are from recorded sales; nothing here is an opinion of the value of any home.